Download Fortinet NSE 4 - FortiOS 7.6 Administrator.NSE4_FGT_AD-7.6.DumpsBase.2026-07-22.30q.vcex
| Vendor: | Fortinet |
| Exam Code: | NSE4_FGT_AD-7.6 |
| Exam Name: | Fortinet NSE 4 - FortiOS 7.6 Administrator |
| Date: | Jul 22, 2026 |
| File Size: | 5 MB |
How to open VCEX files?
Files with VCEX extension can be opened by ProfExam Simulator.
Purchase
Coupon: TAURUSSIM_20OFF
Discount: 20%
Demo Questions
Question 1
When configuring firewall policies which of the following is true regarding the policy ID? (Choose two.)
- A firewall policy ID identifies the order of policy execution in firewall policies.
- A policy ID cannot be modified once a policy is created.
- You can create a policy in CLI with policy ID 0
- It is mandatory to provide a policy ID while creating a firewall policy regardless of GUI or CL
Correct answer: A, B, C
Question 2
An administrator wants to form an HA cluster using the FGCP protocol.
Which two requirements must the administrator ensure both members fulfill? (Choose two answers)
- They must have the same HA group I
- They must have the heartbeat interfaces in the same subnet.
- They must have the same number of configured VDOMs.
- They must have the same hard drive configuration.
Correct answer: A, C
Explanation:
“To successfully form an HA cluster, you must ensure that the members have the same:• Model: hardware model or VM model• Firmware version• Licensing: includes the FortiGuard license, virtual domain (VDOM) license, FortiClient license, and so on• Hard drive configuration: the same number and size of drives and partitions• Operating mode: the operating mode―NAT mode or transparent mode―of the management VDOM.”“From a configuration and setup point of view, you must ensure that the HA settings on each member have the same group ID, group name, password, and heartbeat interface settings. Try to place all heartbeat interfaces in the same broadcast domain, or for two-member clusters, connect them directly.”Technical Deep Dive:The correct answers are A and D.A is correct because FGCP cluster formation requires matching HA parameters, and group ID is explicitly one of them. If the group ID differs, the units will not consider each other part of the same cluster during HA discovery and election.D is correct because FortiGate HA expects hardware parity in critical platform characteristics, including hard drive configuration. If disk layout differs, the members do not satisfy the HA formation prerequisites.B is incorrect because the study guide does not require heartbeat interfaces to be in the same IP subnet. The requirement is that heartbeat links be in the same broadcast domain, or directly connected in a two-node design. In practice, heartbeat links are Layer 2 adjacency links; IP subnet matching is not the stated requirement.C is incorrect because the guide does not say both units must start with the same number of configured VDOMs.What must match is the licensing level and the operating mode of the management VDOM. After cluster formation, the primary synchronizes its configuration to the secondary.A practical verification set before forming FGCP HA is:get system statusshow system hadiagnose sys ha statusOperationally, FGCP then uses the heartbeat links for member discovery, health monitoring, election, and config/session synchronization. On supported hardware, session forwarding and HA processing can still benefit from FortiGate’s ASIC-assisted architecture, but HA state, config sync, and election logic remain control-plane functions handled by FortiOS. “To successfully form an HA cluster, you must ensure that the members have the same:
• Model: hardware model or VM model
• Firmware version
• Licensing: includes the FortiGuard license, virtual domain (VDOM) license, FortiClient license, and so on
• Hard drive configuration: the same number and size of drives and partitions
• Operating mode: the operating mode―NAT mode or transparent mode―of the management VDOM.”
“From a configuration and setup point of view, you must ensure that the HA settings on each member have the same group ID, group name, password, and heartbeat interface settings. Try to place all heartbeat interfaces in the same broadcast domain, or for two-member clusters, connect them directly.”
Technical Deep Dive:
The correct answers are A and D.
A is correct because FGCP cluster formation requires matching HA parameters, and group ID is explicitly one of them. If the group ID differs, the units will not consider each other part of the same cluster during HA discovery and election.
D is correct because FortiGate HA expects hardware parity in critical platform characteristics, including hard drive configuration. If disk layout differs, the members do not satisfy the HA formation prerequisites.
B is incorrect because the study guide does not require heartbeat interfaces to be in the same IP subnet. The requirement is that heartbeat links be in the same broadcast domain, or directly connected in a two-node design. In practice, heartbeat links are Layer 2 adjacency links; IP subnet matching is not the stated requirement.
C is incorrect because the guide does not say both units must start with the same number of configured VDOMs.
What must match is the licensing level and the operating mode of the management VDOM. After cluster formation, the primary synchronizes its configuration to the secondary.
A practical verification set before forming FGCP HA is:
get system status
show system ha
diagnose sys ha status
Operationally, FGCP then uses the heartbeat links for member discovery, health monitoring, election, and config/session synchronization. On supported hardware, session forwarding and HA processing can still benefit from FortiGate’s ASIC-assisted architecture, but HA state, config sync, and election logic remain control-plane functions handled by FortiOS.
Question 3
Refer to the exhibit.
 Which two ways can you view the log messages shown in the exhibit? (Choose two.)
- By right clicking the implicit deny policy
- Using the FortiGate CLI command diagnose log test
- By filtering by policy universally unique identifier (UUID) and application name in the log entry
- In the Forward Traffic section
Correct answer: C, D
Explanation:
The exhibit shows a FortiGate UTM application control log with fields such as:type="utm"subtype="app-ctrl"action="block"policyid=1appid=30220appcat="Video/Audio"service="HTTP"apprisk="elevated"This is a forward traffic security log, generated by Application Control applied to a firewall policy.Why the correct answers are C and DC. By filtering by policy universally unique identifier (UUID) and application name in the log entry Correct.FortiOS logs can be viewed and filtered in:Log & Report → Forward TrafficAdministrators can filter logs using fields such as:Policy ID / Policy UUIDApplication name (app)Application ID (appid)The log entry clearly includes application-related fields, making filtering by policy and application a valid and documented way to view these logs.D. In the Forward Traffic sectionCorrect.The log is a UTM Application Control log for traffic passing through a firewall policy.Such logs are displayed under:Log & Report → Forward TrafficThis is the standard and correct location to view application control, web filter, IPS, and other security profile logs related to user traffic.Why the other options are incorrectA. By right clicking the implicit deny policyIncorrect.Implicit deny policies do not generate UTM forward traffic logs like the one shown.Application control logs are generated only by explicit firewall policies with security profiles enabled.B. Using the FortiGate CLI command diagnose log testIncorrect.diagnose log test is used to test log connectivity and log settings, not to view historical log entries.It does not display traffic or UTM logs. The exhibit shows a FortiGate UTM application control log with fields such as:
type="utm"
subtype="app-ctrl"
action="block"
policyid=1
appid=30220
appcat="Video/Audio"
service="HTTP"
apprisk="elevated"
This is a forward traffic security log, generated by Application Control applied to a firewall policy.
Why the correct answers are C and D
C. By filtering by policy universally unique identifier (UUID) and application name in the log entry Correct.
FortiOS logs can be viewed and filtered in:
Log & Report → Forward Traffic
Administrators can filter logs using fields such as:
Policy ID / Policy UUID
Application name (app)
Application ID (appid)
The log entry clearly includes application-related fields, making filtering by policy and application a valid and documented way to view these logs.
D. In the Forward Traffic section
Correct.
The log is a UTM Application Control log for traffic passing through a firewall policy.
Such logs are displayed under:
Log & Report → Forward Traffic
This is the standard and correct location to view application control, web filter, IPS, and other security profile logs related to user traffic.
Why the other options are incorrect
A. By right clicking the implicit deny policy
Incorrect.
Implicit deny policies do not generate UTM forward traffic logs like the one shown.
Application control logs are generated only by explicit firewall policies with security profiles enabled.
B. Using the FortiGate CLI command diagnose log test
Incorrect.
diagnose log test is used to test log connectivity and log settings, not to view historical log entries.
It does not display traffic or UTM logs.
Question 4
Refer to the exhibits.
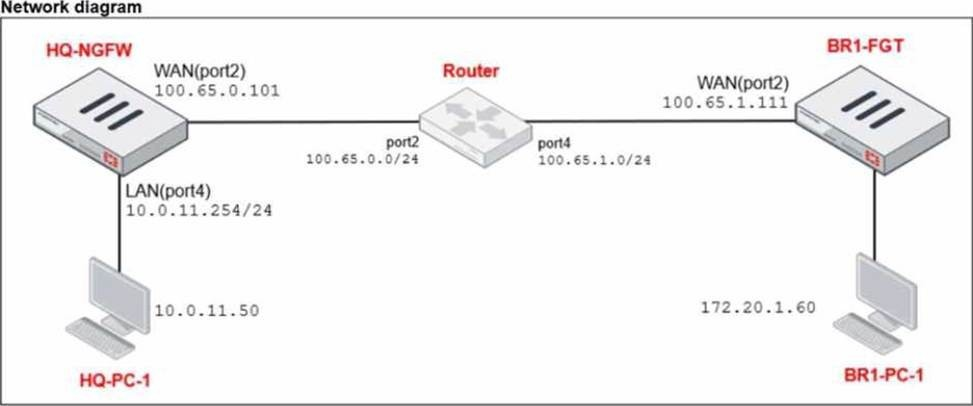
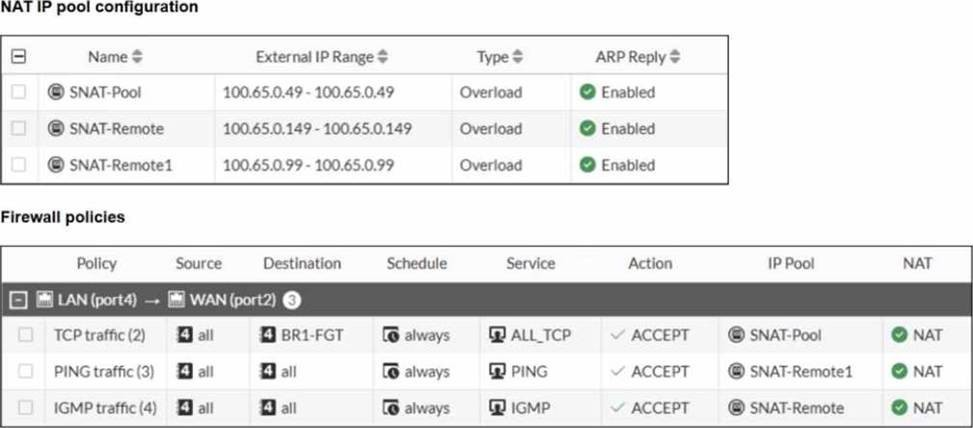
The exhibits show a diagram of a FortiGate device connected to the network, as well as the IP pool configuration and firewall policy objects.
The WAN (port2) interface has the IP address
100.65.0.101/24.
The LAN (port4) interface has the IP address
10.0.11.254/24.
Which IP address will be used to source NAT (SNAT) the traffic, if the user on HQ-PC-1 (10.0.11.50) pings the IP address of BR-FGT (100.65.1.111)?
- 100.65.0.101
- 100.65.0.49
- 100.65.0.149
- 100.65.0.99
Correct answer: D
Explanation:
From the exhibits, there are three relevant firewall policies from LAN (port4) to WAN (port2), each using a different IP pool for source NAT:TCP trafficService: ALL_TCPDestination: BR1-FGTIP Pool: SNAT-Pool → 100.65.0.49PING trafficService: PINGDestination: allIP Pool: SNAT-Remote1 → 100.65.0.99IGMP trafficService: IGMPDestination: allIP Pool: SNAT-Remote → 100.65.0.149The user on HQ-PC-1 (10.0.11.50) is pinging BR1-FGT (100.65.1.111). In FortiOS, policy matching is based on (among other fields) source, destination, and service, and the first matching policy in top-down order is applied.Because the traffic is ICMP echo (ping), it matches the policy named PING traffic (service PING, destination all). That policy explicitly uses Use Dynamic IP Pool with SNAT-Remote1, which is configured with external IP 100.65.0.99.Therefore, the source NAT IP used for this ping is 100.65.0.99. From the exhibits, there are three relevant firewall policies from LAN (port4) to WAN (port2), each using a different IP pool for source NAT:
TCP traffic
Service: ALL_TCP
Destination: BR1-FGT
IP Pool: SNAT-Pool → 100.65.0.49
PING traffic
Service: PING
Destination: all
IP Pool: SNAT-Remote1 → 100.65.0.99
IGMP traffic
Service: IGMP
Destination: all
IP Pool: SNAT-Remote → 100.65.0.149
The user on HQ-PC-1 (10.0.11.50) is pinging BR1-FGT (100.65.1.111). In FortiOS, policy matching is based on (among other fields) source, destination, and service, and the first matching policy in top-down order is applied.
Because the traffic is ICMP echo (ping), it matches the policy named PING traffic (service PING, destination all). That policy explicitly uses Use Dynamic IP Pool with SNAT-Remote1, which is configured with external IP 100.65.0.99.
Therefore, the source NAT IP used for this ping is 100.65.0.99.
Question 5
Refer to the exhibit.
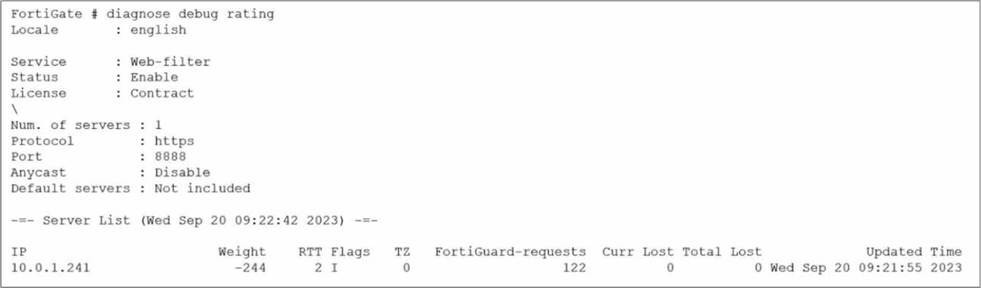
Which two statements about the FortiGuard connection are true? (Choose two.)
- The weight increases as the number of failed packets rises
- You can configure unreliable protocols to communicate with FortiGuard Server.
- FortiGate identified the FortiGuard Server using DNS lookup.
- FortiGate is using the default port for FortiGuard communication.
Correct answer: A, D
Explanation:
Based on the diagnose debug rating output provided in the exhibit and the standard behavior of the FortiGuard connection mechanism in FortiOS 7.6:Weight Calculation (Statement A is True):In FortiOS, the rating server selection process uses a weight-based system.According to official documentation, the weight increases with failed packets (lost responses) and decreases with successful packets.This mechanism ensures that servers with poor reliability are penalized by having higher weights, effectively pushing them to the bottom of the preference list.Default Port Communication (Statement D is True):The exhibit explicitly shows the communication is using HTTPS on port 8888.In FortiOS 7.6 (and legacy versions like 6.2/6.4), FortiGuard filtering supports specific protocols and ports: HTTPS on ports 443, 53, and 8888, where 8888 is considered a default port for FortiGuard queries.Ports 53 and 8888 are standard for both UDP and TCP/HTTPS FortiGuard communications to avoid common firewall blocks on standard web ports.Why other options are incorrect:Statement B (Unreliable protocols): While you can configure UDP (which is unreliable), the exhibit specifically shows HTTPS is being used, which is a reliable (TCP-based) protocol.Statement C (DNS lookup): In the "Flags" column of the server list, a server found via DNS lookup would be marked with the "D" flag. The exhibit shows the flag as "I" (indicating the last INIT request was sent to this server) and a numeric "2," but the "D" flag is absent. Additionally, the IP 10.0.1.241 is a private address, suggesting it is a manually configured FortiManager or local override server rather than a public server found via global DNS lookup. Based on the diagnose debug rating output provided in the exhibit and the standard behavior of the FortiGuard connection mechanism in FortiOS 7.6:
Weight Calculation (Statement A is True):
In FortiOS, the rating server selection process uses a weight-based system.
According to official documentation, the weight increases with failed packets (lost responses) and decreases with successful packets.
This mechanism ensures that servers with poor reliability are penalized by having higher weights, effectively pushing them to the bottom of the preference list.
Default Port Communication (Statement D is True):
The exhibit explicitly shows the communication is using HTTPS on port 8888.
In FortiOS 7.6 (and legacy versions like 6.2/6.4), FortiGuard filtering supports specific protocols and ports: HTTPS on ports 443, 53, and 8888, where 8888 is considered a default port for FortiGuard queries.
Ports 53 and 8888 are standard for both UDP and TCP/HTTPS FortiGuard communications to avoid common firewall blocks on standard web ports.
Why other options are incorrect:
Statement B (Unreliable protocols): While you can configure UDP (which is unreliable), the exhibit specifically shows HTTPS is being used, which is a reliable (TCP-based) protocol.
Statement C (DNS lookup): In the "Flags" column of the server list, a server found via DNS lookup would be marked with the "D" flag. The exhibit shows the flag as "I" (indicating the last INIT request was sent to this server) and a numeric "2," but the "D" flag is absent. Additionally, the IP 10.0.1.241 is a private address, suggesting it is a manually configured FortiManager or local override server rather than a public server found via global DNS lookup.
Question 6
Refer to the exhibit.
 As an administrator you have created an IPS profile, but it is not performing as expected. While testing you got the output as shown in the exhibit.
What could be the possible reason of the diagnose output shown in the exhibit?
- There is a no firewall policy configured with an IPS security profile.
- Administrator entered the command diagnose test application ipsmonitor 5.
- FortiGate entered into IPS fail open state.
- Administrator entered the command diagnose test application ipsmonitor 99.
Correct answer: A
Explanation:
The exhibit shows the output of the following command:diagnose test application ipsmonitor 1pid = 2044, engine count = 0 (+1)0 - pid:2074:2074 cfg:1 master:0 run:1How to interpret this output (FortiOS 7.6 C IPS internals)ipsmonitor displays the status of IPS engines running on the FortiGate.engine count = 0 means:No IPS scanning engines are currently activeIPS is not processing any trafficIn FortiOS, IPS engines are started on demand.Critical documented behaviorIPS processes are only spawned when at least one firewall policy is configured with an IPS profile and traffic matches that policy.If no firewall policy references an IPS profile, the IPS engine:Does not startShows engine count = 0Appears “not working,” even though the IPS profile existsThis is exactly what the diagnose output indicates.Why option A is correctA. There is no firewall policy configured with an IPS security profile.Creating an IPS profile alone is not sufficientIPS must be applied to an active firewall policyTraffic must match that policy for the IPS engine to runOtherwise, ipsmonitor will show engine count = 0This matches FortiOS 7.6 IPS operational behavior.Why the other options are incorrectB. Administrator entered the command diagnose test application ipsmonitor 5.Incorrect.The exhibit clearly shows ipsmonitor 1Using a different argument would not explain engine count = 0 C. FortiGate entered into IPS fail open state. Incorrect.In fail-open, IPS engines may be bypassed, but they still initialize engine count = 0 specifically indicates IPS is not in use at allD. Administrator entered the command diagnose test application ipsmonitor 99.Incorrect.The command argument affects debug level, not engine creation Again, the exhibit shows ipsmonitor 1 The exhibit shows the output of the following command:
diagnose test application ipsmonitor 1
pid = 2044, engine count = 0 (+1)
0 - pid:2074:2074 cfg:1 master:0 run:1
How to interpret this output (FortiOS 7.6 C IPS internals)
ipsmonitor displays the status of IPS engines running on the FortiGate.
engine count = 0 means:
No IPS scanning engines are currently active
IPS is not processing any traffic
In FortiOS, IPS engines are started on demand.
Critical documented behavior
IPS processes are only spawned when at least one firewall policy is configured with an IPS profile and traffic matches that policy.
If no firewall policy references an IPS profile, the IPS engine:
Does not start
Shows engine count = 0
Appears “not working,” even though the IPS profile exists
This is exactly what the diagnose output indicates.
Why option A is correct
A. There is no firewall policy configured with an IPS security profile.
Creating an IPS profile alone is not sufficient
IPS must be applied to an active firewall policy
Traffic must match that policy for the IPS engine to run
Otherwise, ipsmonitor will show engine count = 0
This matches FortiOS 7.6 IPS operational behavior.
Why the other options are incorrect
B. Administrator entered the command diagnose test application ipsmonitor 5.
Incorrect.
The exhibit clearly shows ipsmonitor 1
Using a different argument would not explain engine count = 0 C. FortiGate entered into IPS fail open state. Incorrect.
In fail-open, IPS engines may be bypassed, but they still initialize engine count = 0 specifically indicates IPS is not in use at all
D. Administrator entered the command diagnose test application ipsmonitor 99.
Incorrect.
The command argument affects debug level, not engine creation Again, the exhibit shows ipsmonitor 1
Question 7
Which two statements are correct when the FortiGate device enters conserve mode? (Choose two.)
- FortiGate refuses to accept configuration changes.
- FortiGate halts complete system operation and requires a reboot to regain available resources.
- FortiGate continues to transmit packets without IPS inspection when the fail-open global setting in IPS is enabled.
- FortiGate continues to run critical security actions, such as quarantine.
Correct answer: A, C
Question 8
Refer to the exhibit.
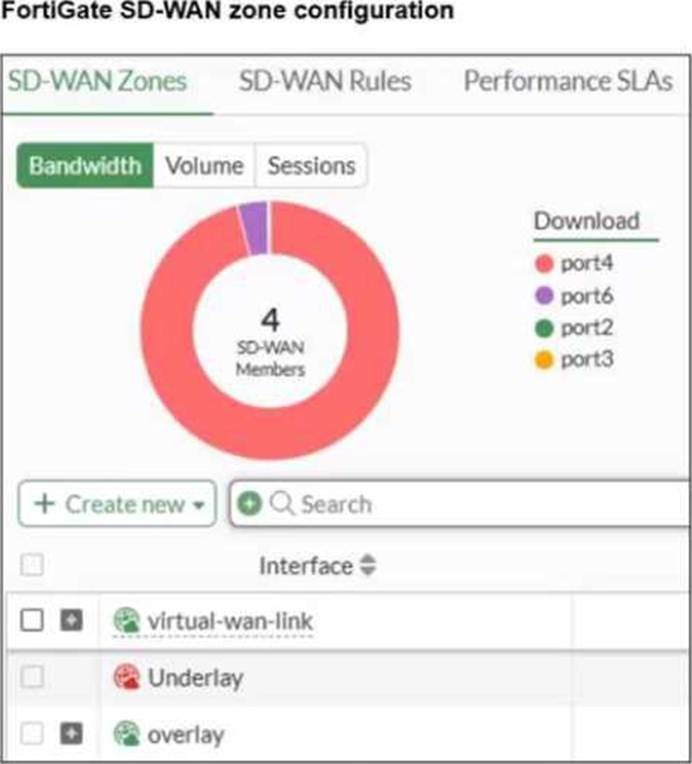 An SD-WAN zone configuration on the FortiGate GUI is shown. Based on the exhibit, which statement is true?
- The Underlay zone contains no member.
- The virtual-wan-link and overlay zones can be deleted
- The Underlay zone is the zone by default.
- port2 and port3 are not assigned to a zone.
Correct answer: A
Explanation:
According to the FortiOS 7.6 Administrator Guide and the specific behavior of the SD-WAN GUI, here is the technical breakdown:SD-WAN Zone Hierarchy and UI Elements: In the FortiGate GUI, SD-WAN zones that contain member interfaces are displayed with a plus (+) icon next to the checkbox. This icon allows administrators to expand the zone and view the specific physical or logical interfaces assigned to it.Analysis of the "Underlay" Zone: In the provided exhibit, the virtual-wan-link and overlay zones both feature the plus (+) expansion icon, indicating they have active members. The Underlay zone, however, lacks this icon and displays a red status icon. This is the visual indicator in FortiOS that the zone is currently empty and contains no member interfaces.Mandatory Zone Membership: In FortiOS 7.x, every SD-WAN member interface must be assigned to a zone. It is not possible for an interface to be an "SD-WAN member" (as shown in the legend with port2 and port3) without being assigned to a zone. Since port2 and port3 are listed in the legend, they are indeed assigned to one of the other expanded zones (likely virtual-wan-link or overlay), making Option D incorrect.Default Zone Behavior: While FortiOS 7.6 often creates default zones like virtual-wan-link, underlay, and overlay during certain configuration wizards or by default in newer versions, they are distinct entities. There is no single "default" zone that acts as a global catch-all in the way Option C suggests.Immutability of System Zones: While certain system-defined zones have restrictions, the primary focus of this specific exhibit is the current membership state, which clearly shows the Underlay zone is empty. According to the FortiOS 7.6 Administrator Guide and the specific behavior of the SD-WAN GUI, here is the technical breakdown:
SD-WAN Zone Hierarchy and UI Elements: In the FortiGate GUI, SD-WAN zones that contain member interfaces are displayed with a plus (+) icon next to the checkbox. This icon allows administrators to expand the zone and view the specific physical or logical interfaces assigned to it.
Analysis of the "Underlay" Zone: In the provided exhibit, the virtual-wan-link and overlay zones both feature the plus (+) expansion icon, indicating they have active members. The Underlay zone, however, lacks this icon and displays a red status icon. This is the visual indicator in FortiOS that the zone is currently empty and contains no member interfaces.
Mandatory Zone Membership: In FortiOS 7.x, every SD-WAN member interface must be assigned to a zone. It is not possible for an interface to be an "SD-WAN member" (as shown in the legend with port2 and port3) without being assigned to a zone. Since port2 and port3 are listed in the legend, they are indeed assigned to one of the other expanded zones (likely virtual-wan-link or overlay), making Option D incorrect.
Default Zone Behavior: While FortiOS 7.6 often creates default zones like virtual-wan-link, underlay, and overlay during certain configuration wizards or by default in newer versions, they are distinct entities. There is no single "default" zone that acts as a global catch-all in the way Option C suggests.
Immutability of System Zones: While certain system-defined zones have restrictions, the primary focus of this specific exhibit is the current membership state, which clearly shows the Underlay zone is empty.
Question 9
Refer to the exhibits.
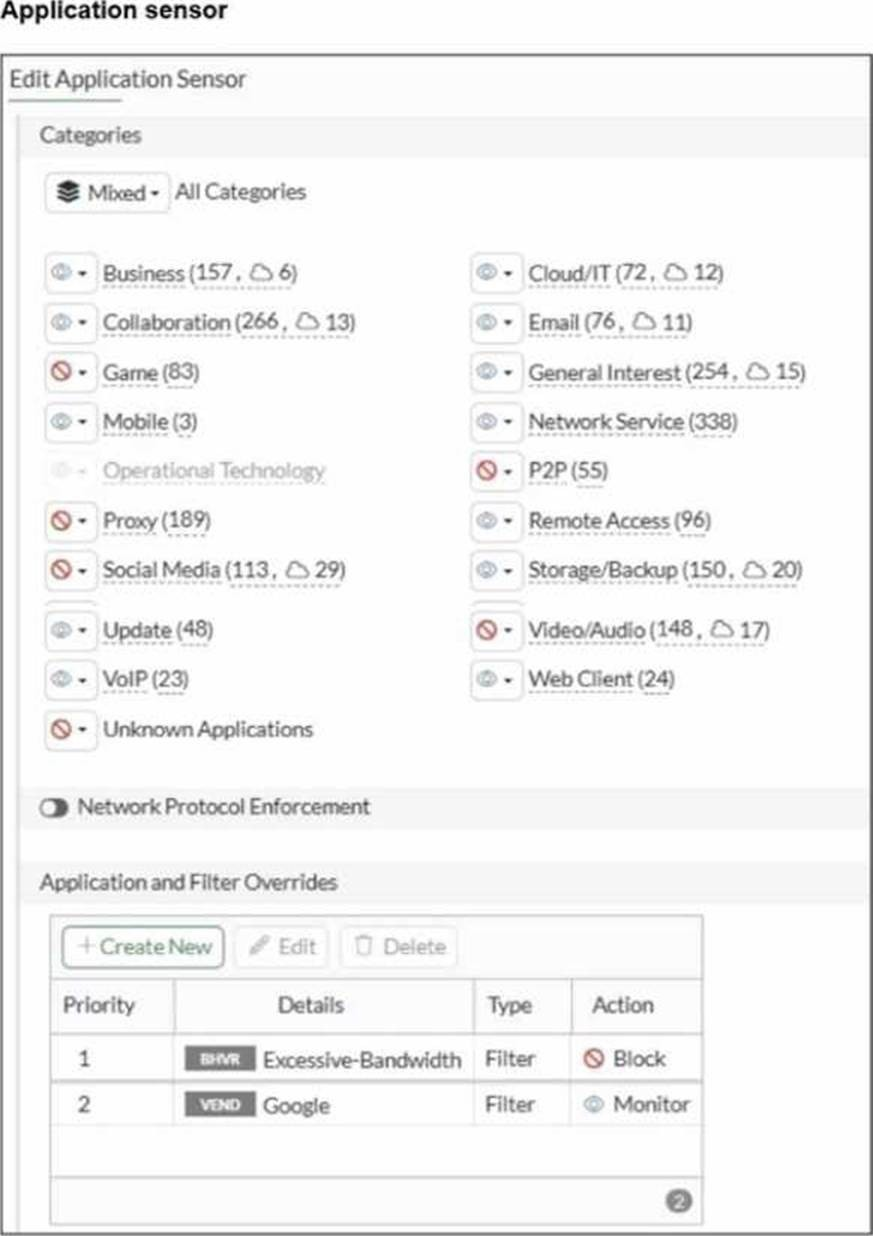
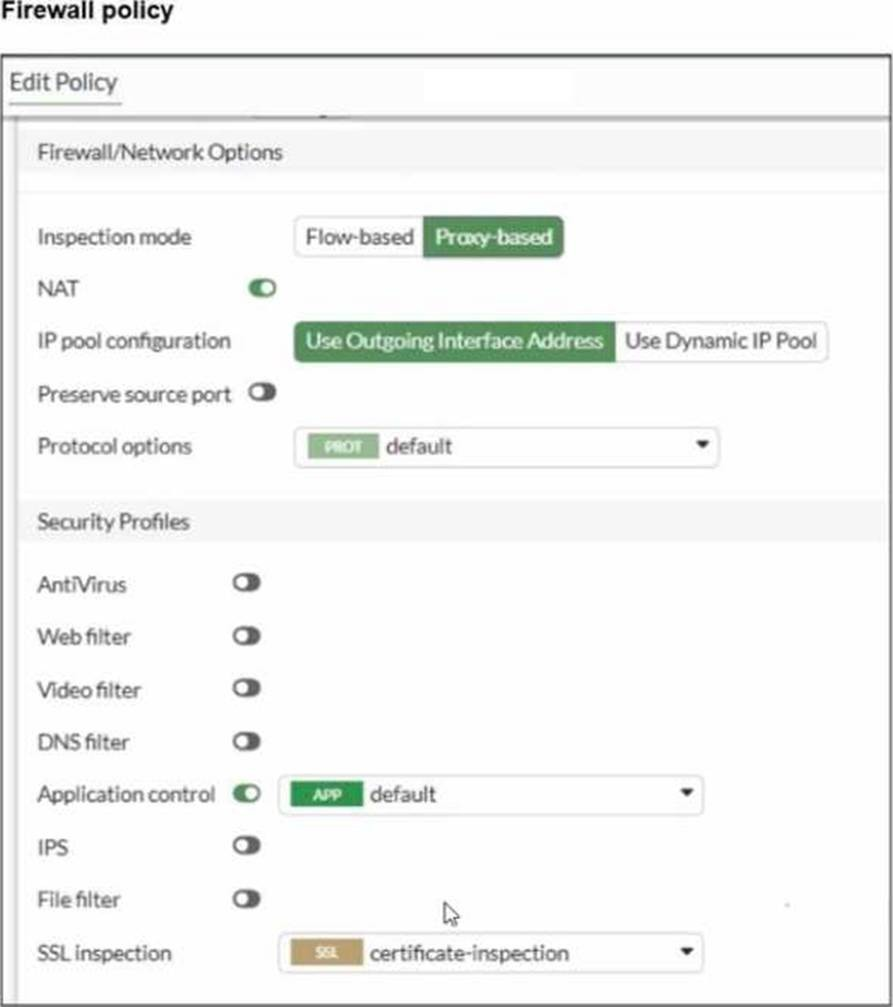
You have implemented the application sensor and the corresponding firewall policy as shown in the exhibits.
You cannot access any of the Google applications, but you are able to access www.fortinet.com.
Which two actions would you take to resolve the issue? (Choose two.)
- Set SSL inspection to deep-content inspection.
- Move up Google in the Application and Filter Overrides section to set its priority lot
- Add "Google".com to the URL category in the security profile.
- Change the Inspection mode to Flow-based
- Set the action for Google in the Application and Filter Overrides section to Allow
Correct answer: A, B, E
Explanation:
From the exhibits:The firewall policy has Application Control enabled and uses certificate-inspection for SSL inspection.The application sensor has Application and Filter Overrides with the following order (priority):Excessive-Bandwidth with action BlockGoogle (vendor filter) with action MonitorIn FortiOS, Application and Filter Overrides are evaluated by priority (top-down). The first matching override is applied. If traffic matches an earlier override with Block, it will be blocked even if a later override would Monitor/Allow it.Why Google apps fail while www.fortinet.com works:Many Google applications can be detected as (or can trigger) the Excessive-Bandwidth behavior/signature depending on the specific service and traffic pattern.Because Excessive-Bandwidth (Block) is above Google (Monitor), Google-related traffic may match the first rule and be blocked before the Google override is evaluated.Access to www.fortinet.com works because that traffic is not matching the Excessive-Bandwidthoverride.Therefore, to resolve:B. Move up Google in the Application and Filter Overrides section to set its priority higherThis ensures Google matches the Google override before any broader blocking override is applied.E. Set the action for Google in the Application and Filter Overrides section to AllowThis explicitly permits Google applications once the higher-priority match occurs (stronger than Monitor for troubleshooting and ensuring access).Why the other options are not the best fit here:A (deep-content inspection) can help identify more HTTPS applications, but the exhibit already shows a specific Google override configured; the immediate issue is the override evaluation order and action.C relates to Web Filter URL categories, but the problem is occurring under Application Control behavior/vendor overrides.D (flow-based) is not required to fix an override priority/action conflict. From the exhibits:
The firewall policy has Application Control enabled and uses certificate-inspection for SSL inspection.
The application sensor has Application and Filter Overrides with the following order (priority):
Excessive-Bandwidth with action Block
Google (vendor filter) with action Monitor
In FortiOS, Application and Filter Overrides are evaluated by priority (top-down). The first matching override is applied. If traffic matches an earlier override with Block, it will be blocked even if a later override would Monitor/Allow it.
Why Google apps fail while www.fortinet.com works:
Many Google applications can be detected as (or can trigger) the Excessive-Bandwidth behavior/signature depending on the specific service and traffic pattern.
Because Excessive-Bandwidth (Block) is above Google (Monitor), Google-related traffic may match the first rule and be blocked before the Google override is evaluated.
Access to www.fortinet.com works because that traffic is not matching the Excessive-Bandwidth
override.
Therefore, to resolve:
B. Move up Google in the Application and Filter Overrides section to set its priority higher
This ensures Google matches the Google override before any broader blocking override is applied.
E. Set the action for Google in the Application and Filter Overrides section to Allow
This explicitly permits Google applications once the higher-priority match occurs (stronger than Monitor for troubleshooting and ensuring access).
Why the other options are not the best fit here:
A (deep-content inspection) can help identify more HTTPS applications, but the exhibit already shows a specific Google override configured; the immediate issue is the override evaluation order and action.
C relates to Web Filter URL categories, but the problem is occurring under Application Control behavior/vendor overrides.
D (flow-based) is not required to fix an override priority/action conflict.
Question 10
You have created a web filter profile named restrictmedia-profile with a daily category usage quota.
When you are adding the profile to the firewall policy, the restrict_media-profile is not listed in the available web profile drop down.
What could be the reason?
- The web filter profile is already referenced in another firewall policy.
- The firewall policy is in no-inspection mode instead of deep-inspection.
- The naming convention used in the web filter profile is restricting it in the firewall policy.
- The inspection mode in the firewall policy is not matching with web filter profile feature set.
Correct answer: D
Explanation:
In FortiOS 7.6, web filter profiles are inspection-mode dependent. Certain advanced web filtering features―such as daily category usage quota―are only supported when the firewall policy is operating in proxy-based inspection mode.Why the profile is not visibleThe profile restrictmedia-profile includes a daily category usage quota.Daily quotas are a proxy-based web filtering feature.If the firewall policy is configured with:Inspection mode: Flow-basedThen FortiGate will not display proxy-only web filter profiles in the Web Filter drop-down list.FortiGate automatically filters the available profiles based on feature compatibility with the policy’s inspection mode.This behavior is explicitly documented in the FortiOS 7.6 Web Filtering and Inspection Mode Compatibility sections.Why the other options are incorrectA. Already referenced in another firewall policyWeb filter profiles can be reused across multiple policies. This does not hide them.B. Firewall policy is in no-inspection mode instead of deep-inspectionSSL inspection depth affects HTTPS visibility, not whether a web filter profile appears in the drop-down list.C. Naming convention restrictionFortiOS does not restrict profile selection based on naming conventions. In FortiOS 7.6, web filter profiles are inspection-mode dependent. Certain advanced web filtering features―such as daily category usage quota―are only supported when the firewall policy is operating in proxy-based inspection mode.
Why the profile is not visible
The profile restrictmedia-profile includes a daily category usage quota.
Daily quotas are a proxy-based web filtering feature.
If the firewall policy is configured with:
Inspection mode: Flow-based
Then FortiGate will not display proxy-only web filter profiles in the Web Filter drop-down list.
FortiGate automatically filters the available profiles based on feature compatibility with the policy’s inspection mode.
This behavior is explicitly documented in the FortiOS 7.6 Web Filtering and Inspection Mode Compatibility sections.
Why the other options are incorrect
A. Already referenced in another firewall policyWeb filter profiles can be reused across multiple policies. This does not hide them.
B. Firewall policy is in no-inspection mode instead of deep-inspectionSSL inspection depth affects HTTPS visibility, not whether a web filter profile appears in the drop-down list.
C. Naming convention restrictionFortiOS does not restrict profile selection based on naming conventions.
Question 11
Refer to the exhibit.
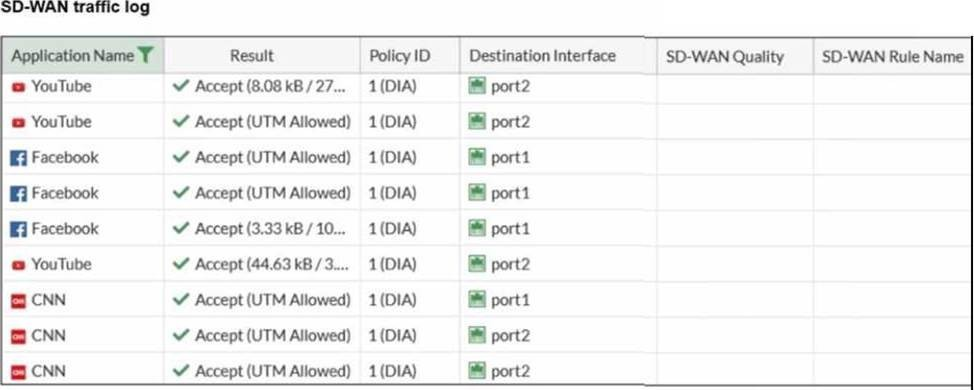
The administrator configured SD-WAN rules and set the FortiGate traffic log page to display SD-WAN-specific columns: SD-WAN Quality and SD-WAN Rule Name
FortiGate allows the traffic according to policy ID 1 placed at the top. This is the policy that allows SD-WAN traffic. Despite these settings, the traffic logs do not show the name of the SD-WAN rule used to steer those traffic flows
What could be the reason?
- SD-WAN rule names do not appear immediately. The administrator must refresh the page.
- There is no application control profile applied to the firewall policy.
- Destinations in the SD-WAN rules are configured for each application, but feature visibility is notenabled.
- FortiGate load balanced the traffic according to the implicit SD-WAN rule.
Correct answer: D
Explanation:
In FortiOS 7.6, SD-WAN steering decisions are recorded in traffic logs only when traffic matches an explicit SD-WAN rule (SD-WAN service rule). When no configured SD-WAN rule matches a session, FortiGate uses the implicit (default) SD-WAN rule/behavior to select a member (often resulting in load-balancing or default selection based on the configured SD-WAN algorithm).In the exhibit, traffic is permitted by firewall policy ID 1, and the Destination Interface alternates between port1 and port2, but SD-WAN Rule Name remains empty. This is consistent with the sessions being forwarded by the implicit SD-WAN rule, which does not populate a named rule in the log columns.Why the other options are not correct:A: SD-WAN rule name logging is not a “delayed display” behavior requiring refresh; it is populated per-session when an explicit rule matches.B: Application Control is not required for SD-WAN rule name to appear. Rule name logging depends on SD-WAN rule match, not on whether Application Control is enabled.C: Feature visibility affects GUI display options, but the exhibit already shows the SD-WAN columns enabled; the issue is that no explicit SD-WAN rule is being hit. In FortiOS 7.6, SD-WAN steering decisions are recorded in traffic logs only when traffic matches an explicit SD-WAN rule (SD-WAN service rule). When no configured SD-WAN rule matches a session, FortiGate uses the implicit (default) SD-WAN rule/behavior to select a member (often resulting in load-balancing or default selection based on the configured SD-WAN algorithm).
In the exhibit, traffic is permitted by firewall policy ID 1, and the Destination Interface alternates between port1 and port2, but SD-WAN Rule Name remains empty. This is consistent with the sessions being forwarded by the implicit SD-WAN rule, which does not populate a named rule in the log columns.
Why the other options are not correct:
A: SD-WAN rule name logging is not a “delayed display” behavior requiring refresh; it is populated per-session when an explicit rule matches.
B: Application Control is not required for SD-WAN rule name to appear. Rule name logging depends on SD-WAN rule match, not on whether Application Control is enabled.
C: Feature visibility affects GUI display options, but the exhibit already shows the SD-WAN columns enabled; the issue is that no explicit SD-WAN rule is being hit.
HOW TO OPEN VCE FILES
Use VCE Exam Simulator to open VCE files
HOW TO OPEN VCEX FILES
Use ProfExam Simulator to open VCEX files
ProfExam at a 20% markdown
You have the opportunity to purchase ProfExam at a 20% reduced price
Get Now!