Download Analyzing and Visualizing Data with Microsoft Excel.70-779.NewDumps.2020-10-30.96q.tqb
| Vendor: | Microsoft |
| Exam Code: | 70-779 |
| Exam Name: | Analyzing and Visualizing Data with Microsoft Excel |
| Date: | Oct 30, 2020 |
| File Size: | 8 MB |
How to open VCEX files?
Files with VCEX extension can be opened by ProfExam Simulator.
Discount: 20%
Demo Questions
Question 1
Note: This question is part of a series of questions that present the same scenario. Each question in the series contains a unique solution that might meet the stated goals. Some question sets might have more than one correct solution, while others might not have a correct solution.
After you answer a question in this section, you will NOT be able to return to it. As a result, these questions will not appear in the review screen.
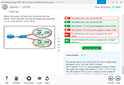
You have an Excel workbook that contains a table named Table1. A sample of the data in Table1 is shown in the following table.

You need to create a PivotTable in PowerPivot as shown in the exhibit. (Click the Exhibit button.)

Solution: You create a measure named products the uses the DataTable DAX function. You add a PivotTable. You drag Products to the Rows field. You drag Price to the Values field.
Does this meet the goal?
- Yes
- No
Correct answer: B
Question 2
Note: This question is part of a series of questions that present the same scenario. Each question in the series contains a unique solution that might meet the stated goals. Some question sets might have more than one correct solution, while others might not have a correct solution.
After you answer a question in this section, you will NOT be able to return to it. As a result, these questions will not appear in the review screen.
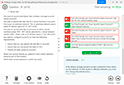
You have an Excel workbook that contains a table named Table1. A sample of the data in Table1 is shown in the following table.

You need to create a PivotTable in PowerPivot as shown in the exhibit. (Click the Exhibit button.)

Solution: You create a hierarchy named Products that contains ProductCategory, ProductSubCategory, and ProductName. You add a PivotTable. You drag Products to the Rows field. You drag Price to the Values field.
Does this meet the goal?
- Yes
- No
Correct answer: A
Question 3
Note: This question is part of a series of questions that present the same scenario. Each question in the series contains a unique solution that might meet the stated goals. Some question sets might have more than one correct solution, while others might not have a correct solution.
After you answer a question in this section, you will NOT be able to return to it. As a result, these questions will not appear in the review screen.
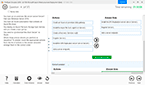
You have an Excel workbook that contains a table named Table1. A sample of the data in Table1 is shown in the following table.
You need to create a PivotTable in PowerPivot as shown in the exhibit. (Click the Exhibit button.)
Solution: You add a PivotTable. You drag ProductCategory, ProductSubCategory, and ProductName to the Rows field. You drag Price to the Values field.
Does this meet the goal?
- Yes
- No
Correct answer: B
HOW TO OPEN VCE FILES
Use VCE Exam Simulator to open VCE files
HOW TO OPEN VCEX AND EXAM FILES
Use ProfExam Simulator to open VCEX and EXAM files
ProfExam at a 20% markdown
You have the opportunity to purchase ProfExam at a 20% reduced price
Get Now!